Abstract:
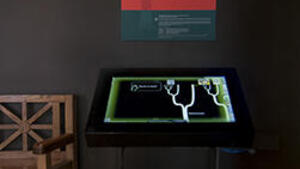
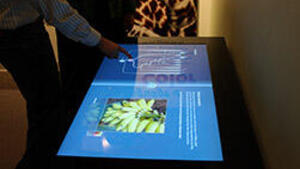
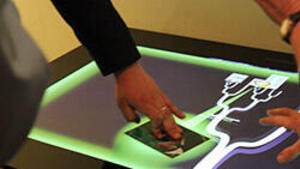
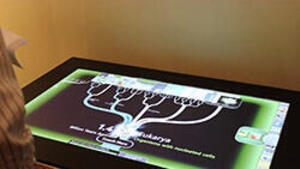
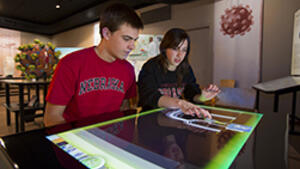
A central goal of many science museums is to provide hands-on experiences in which visitors learn from exhibit elements and through their interactions with other visitors (Falk & Dierking, 2000; Allen, 2004; Humphrey & Gutwill, 2005; Oppenheimer, 1978). These types of experiences are often characterized by physical engagement with scientific phenomena, open-ended exploration, and carefully designed support for collaboration. However, there are many types of experiences that museums might want to offer in this spirit that go beyond the direct manipulation of physical phenomena (Meisner et al., 2007; Louw & Crowley, 2013). In particular, advances in interactive computer displays coupled with new information visualization techniques have made it possible to offer hands-on experiences in which visitors “touch” and explore large scientific datasets (e.g. Louw & Crowley, 2013; Ma et al., 2012; Roberts et al., 2014; Hinrichs, Schmidt, & Carpendale, 2008). Such exhibits create new opportunities for visitors to engage with authentic computational tools (Louw & Crowley, 2013) while at the same time reflecting the evolving nature of scientific inquiry (Henderson, Cortina, & Wing, 2007). Despite these advantages, however, we know little about how such exhibits support learning.


